data scientist · luxembourg

I break numbers before I trust them.

I'm the analyst who finds the flaw in the number everyone already trusted. Now I'm taking data science to the problems analytics can't crack alone.

Bus-delay risk by hour of day, peaking in the morning and evening rush.

Chart of bus-delay risk by hour, from a real project. Risk peaks around 09:00 (39%) and 17:00 (40%), and is lowest in the early hours (around 21%).

From my project: predicting bus delays in Luxembourg →

Two projects. Lead with the data-science proof, back it with the business result.

Business intelligence · cost

Finding a 15% cost leak at a manufacturer

−15% operating expenses.

problem

Rebotec Brasil is a Brazilian manufacturer with a factory and several distribution centers, selling through distributors, retailers, and exports. The company could not see where operating spend was leaking across its sites.

what i did

Built the Power BI dashboards leadership used to track sales, margins and KPIs across commercial and administrative areas; used SQL to extract and clean large datasets; automated recurring financial reports with Excel and Python (pandas); designed and tracked the strategic indicators behind a cost-reduction push; and acted as the primary data partner to senior management.

result

A 15% reduction in operating expenses, and a standing role as the person leadership called when the numbers had to be right.

  • Power BI
  • SQL
  • Excel
  • Python (pandas)

Rebotec Brasil · Business Analyst · 2016-2025

The same four steps, whether it’s a dashboard or a model.

Whether the output is a KPI dashboard or an ML model, the method doesn't change.

01

Frame

I start from the decision, not the data: who needs it, what good looks like, and what counts as success, before I touch a single row.

02

Build

I get the data myself when I have to, whether that means an API or SQL, then turn it into one clean dataset that everything else runs on.

03

Break

Then I try to break it: baselines, leakage checks, and the metric that won't flatter me. A number survives only if it holds up here.

04

Ship

I turn the result into a decision a non-technical room can act on, like a threshold, a risk list, or a recommendation. Then I say plainly where it can't be trusted yet.

Ten years asking what happened. Now I'm asking what happens next.

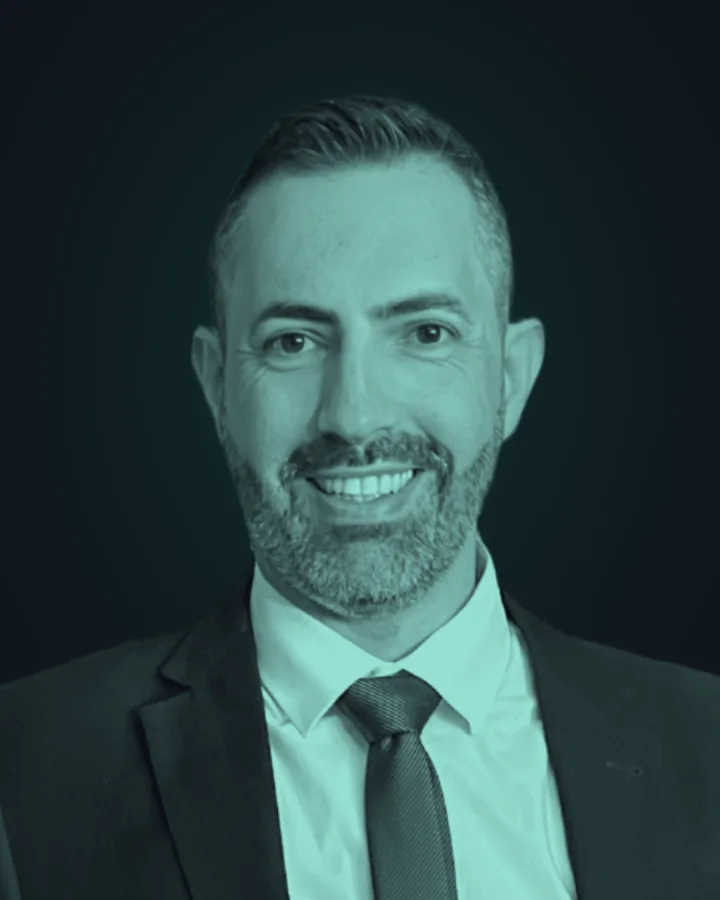
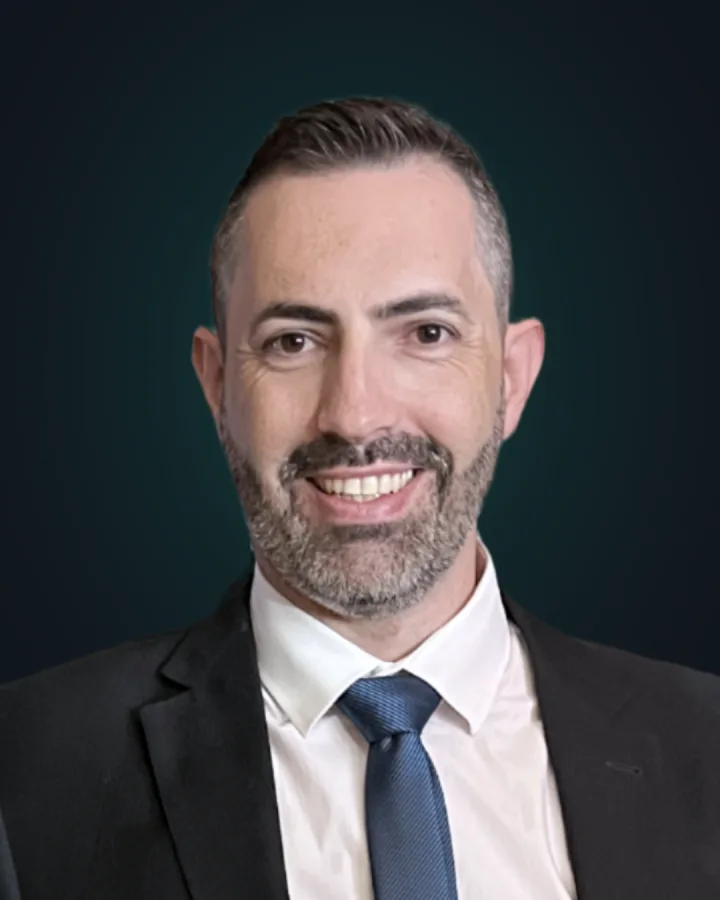
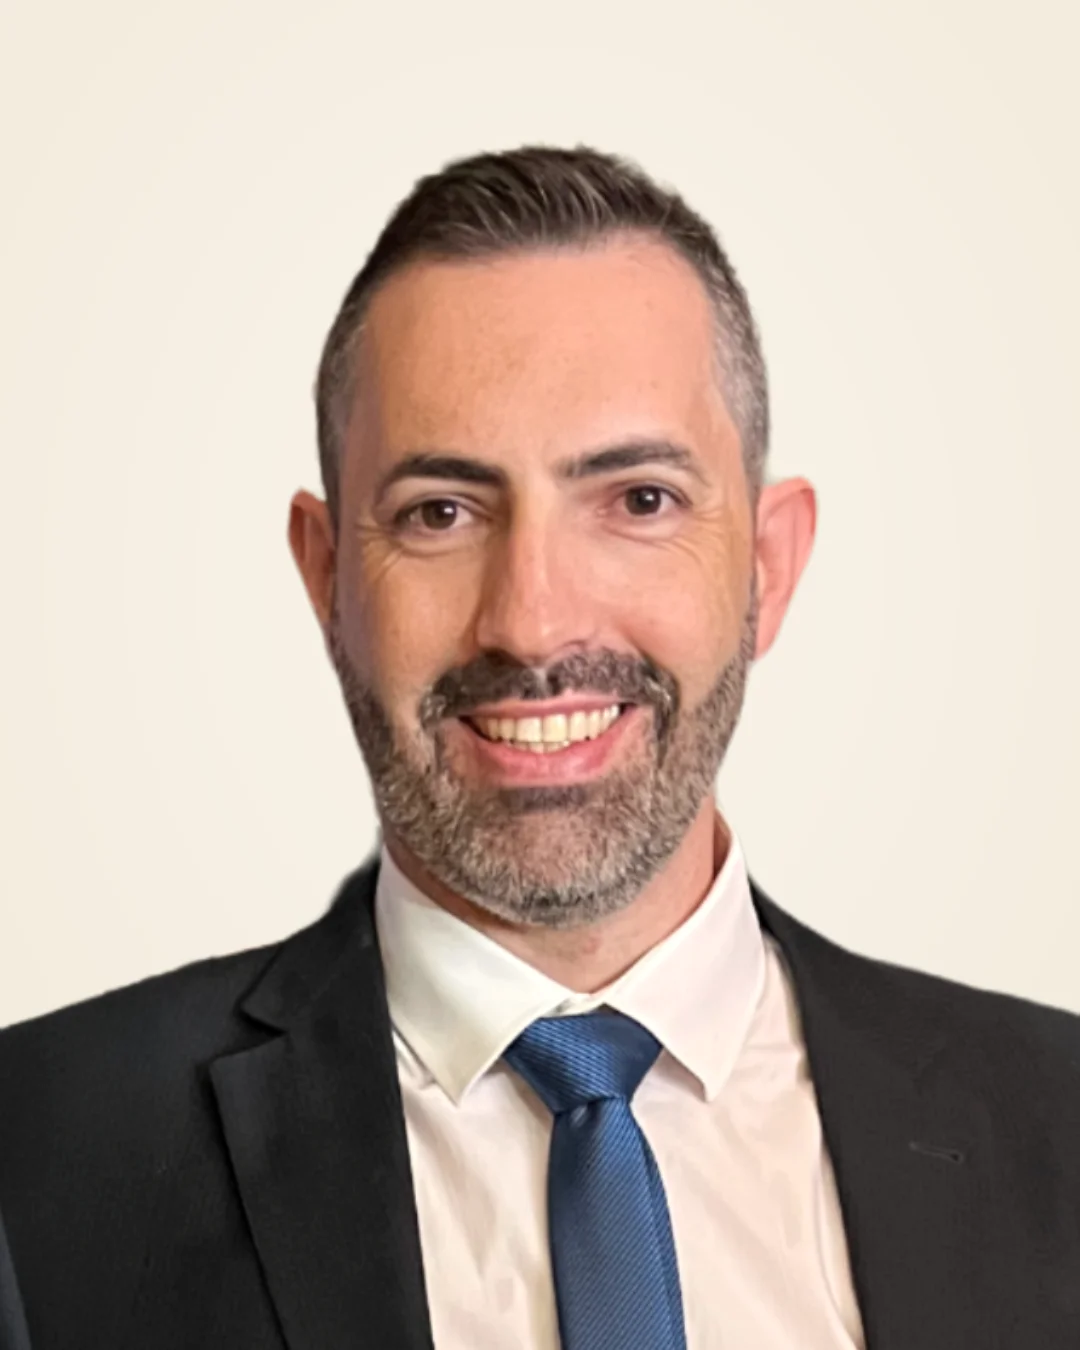
For nine years I was the person Rebotec Brasil (a Brazilian manufacturer that sells through distributors, retailers, and exports) called when the numbers didn't sit right. I built the dashboards leadership ran the business on, and once found 15% of operating costs hiding in plain sight. Now, in Luxembourg, I'm training as a data scientist, learning to predict what I used to only report.

Brazilian, based in Luxembourg, working in three languages.

  • python
  • sql
  • power bi
  • tableau
  • looker studio
  • pandas
  • scikit-learn
  • excel / vba

What I do. Grouped, not rated out of five.

Each of these shows up in the work above, not just on a list.

Analysis

  • Exploratory analysis on messy, real-world data
  • Statistics & probability
  • KPI design and cost analysis
  • A/B testing
  • Feature engineering (leakage-aware)

Machine learning

  • Classification & regression
  • Tree models (Random Forest, Gradient Boosting) vs. interpretable baselines
  • Honest evaluation: F1, precision/recall, ROC-AUC on imbalanced data
  • Threshold tuning to a real decision, not just a metric
  • Knowing where a model can't be trusted, and saying so.

Delivery & communication

  • Dashboards leadership actually uses (Power BI, Tableau)
  • Explaining a result so a non-technical room makes the call
  • Turning a model into something usable: a threshold, a risk list, a recommendation
  • Reproducible workflows and clear documentation
  • Automating recurring reports so they stop eating time

I'm looking for a data science or analytics role in Luxembourg. If that's you, get in touch.

luxembourg · pt / en / fr